📈 Chartbrew
Chartbrew lets teams visualize and monitor metrics from different data sources, all in one place.


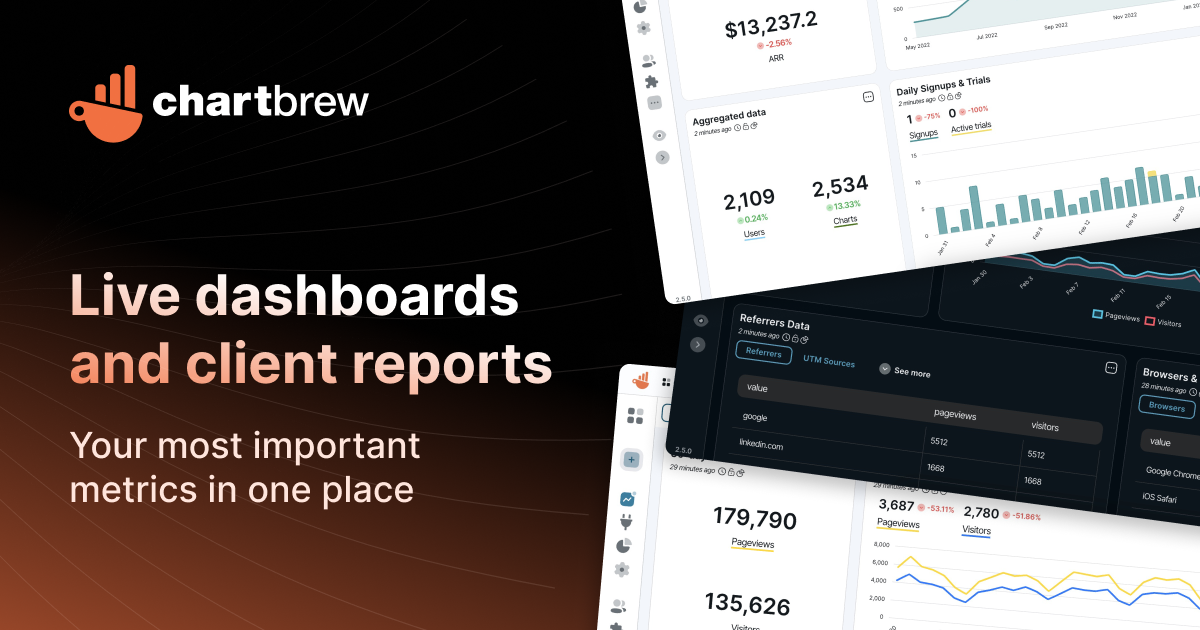
Chartbrew (docs) is a platform that pulls metrics from various data sources and lets teams visualize it in a central location. Teams can monitor and analyze metrics in one place, allowing them to leverage their data more effectively.
The platform integrates with popular products like Google Analytics, Stripe, Timescale, and many others to feed live data directly to users' dashboards.
And it comes with robust documentation.
🤖 As described by AI
(written by AI, edited by humans)
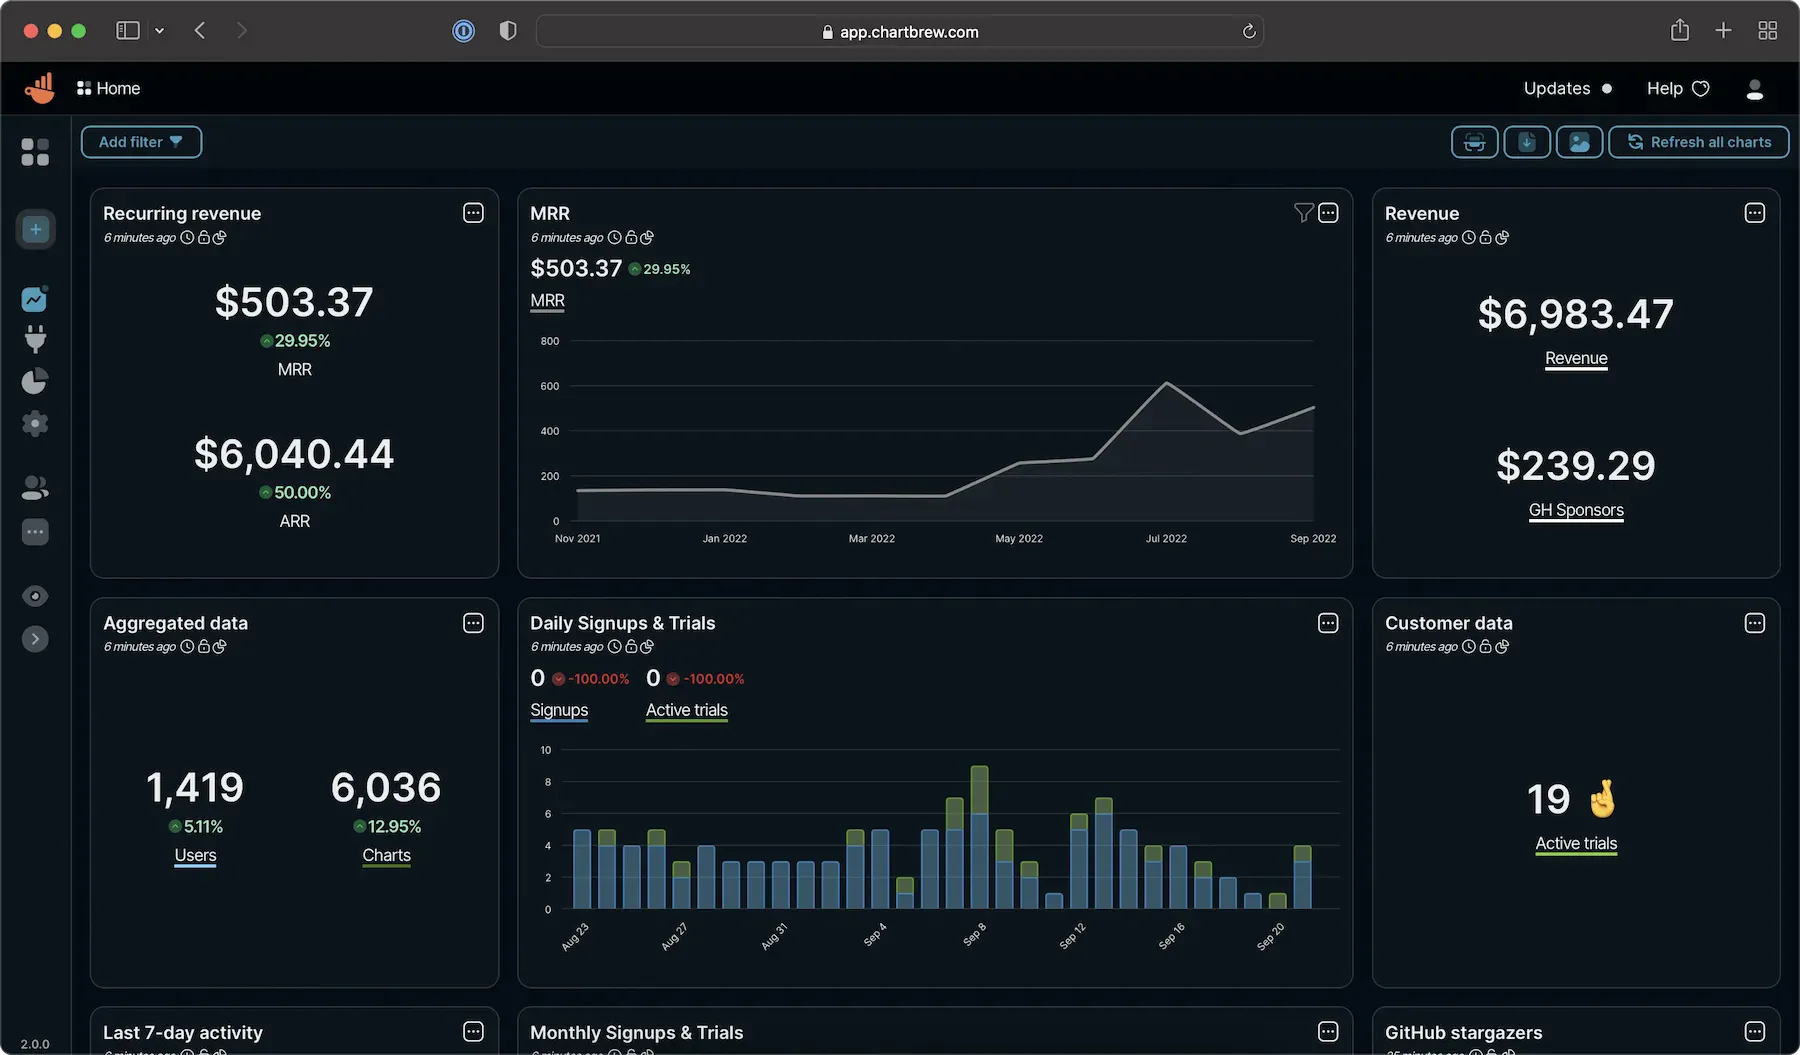
Chartbrew is a software platform designed to help teams and businesses visualize and monitor their data in the form of interactive charts, dashboards, and reports. It offers a user-friendly interface and a range of features.
Users can connect Chartbrew with various data sources to consolidate and view all their data in one location, enabling teams to gain valuable insights and make data-driven decisions.
🌠 Features
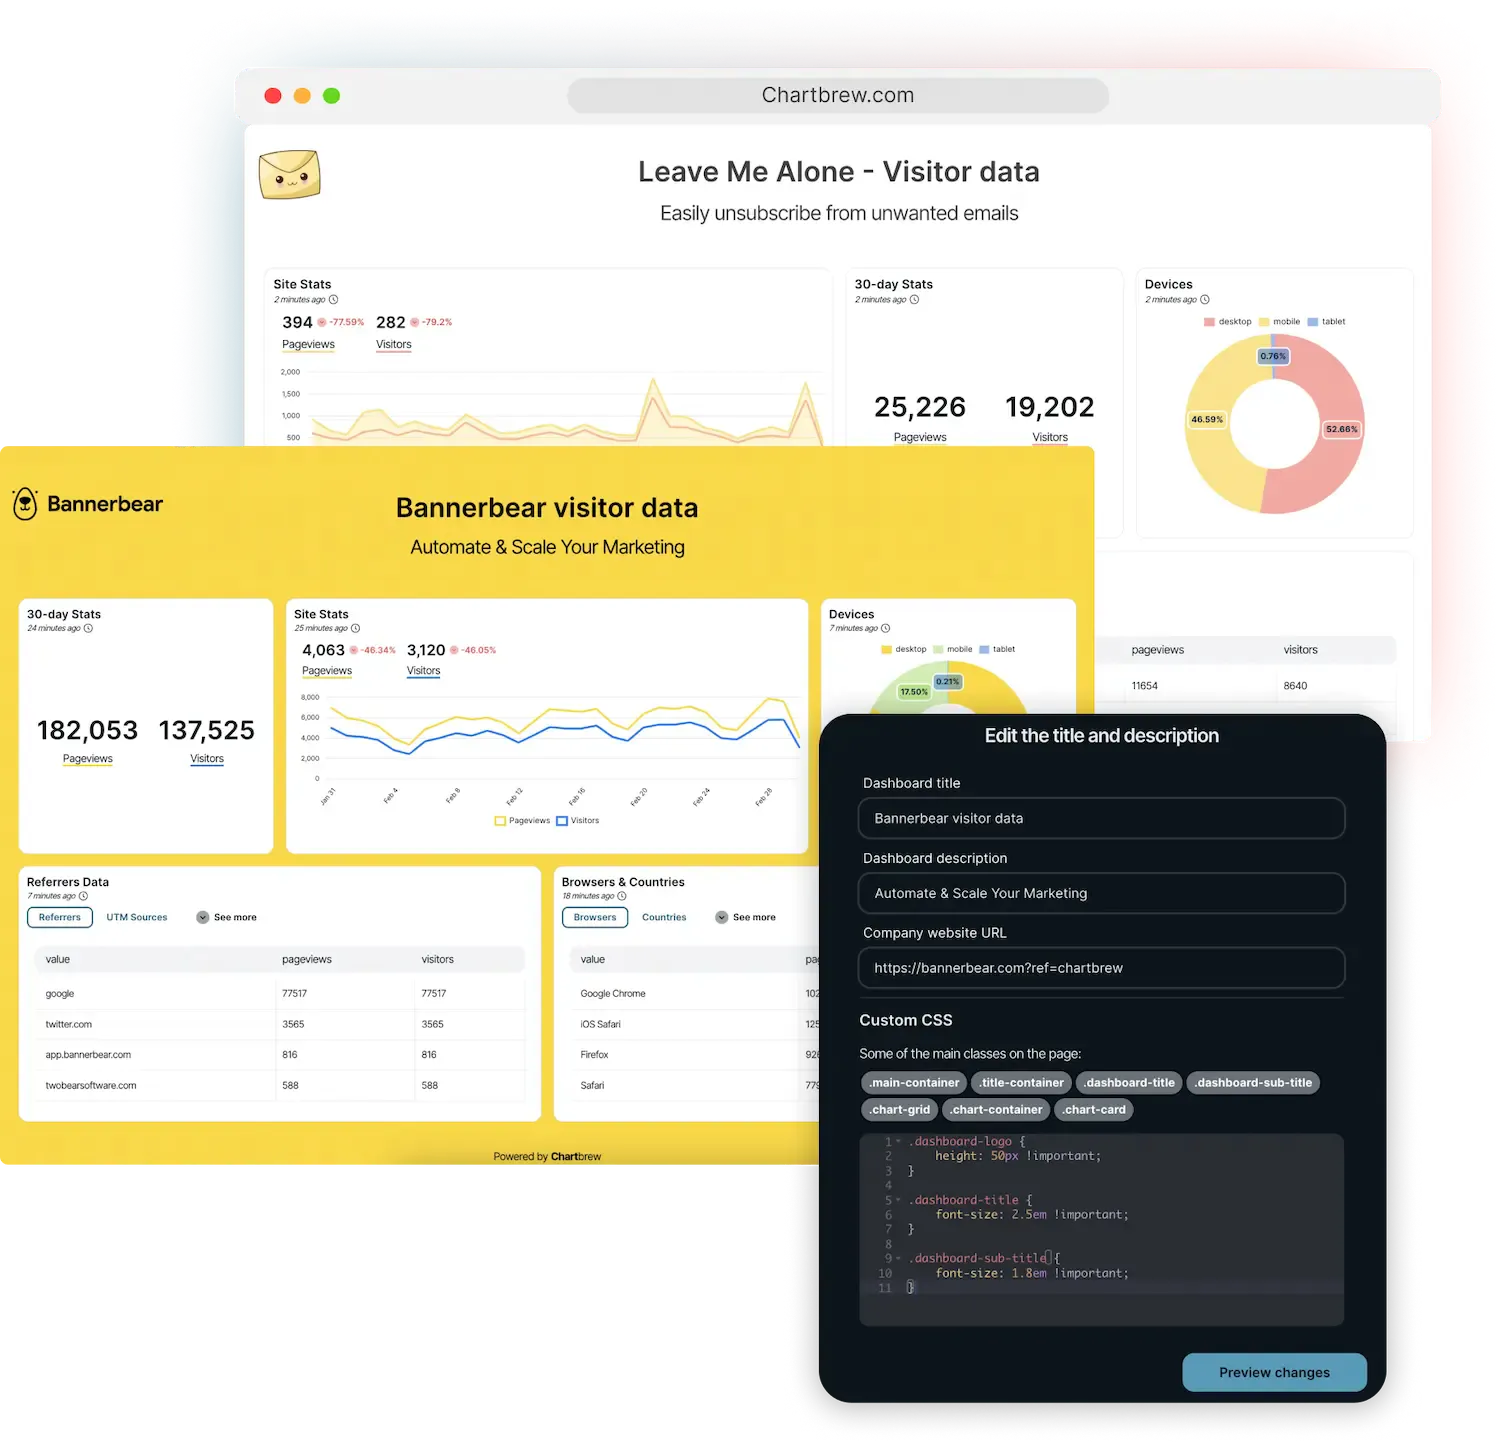
- Client reporting - create client reports from your dashboards and customize them to match your brand
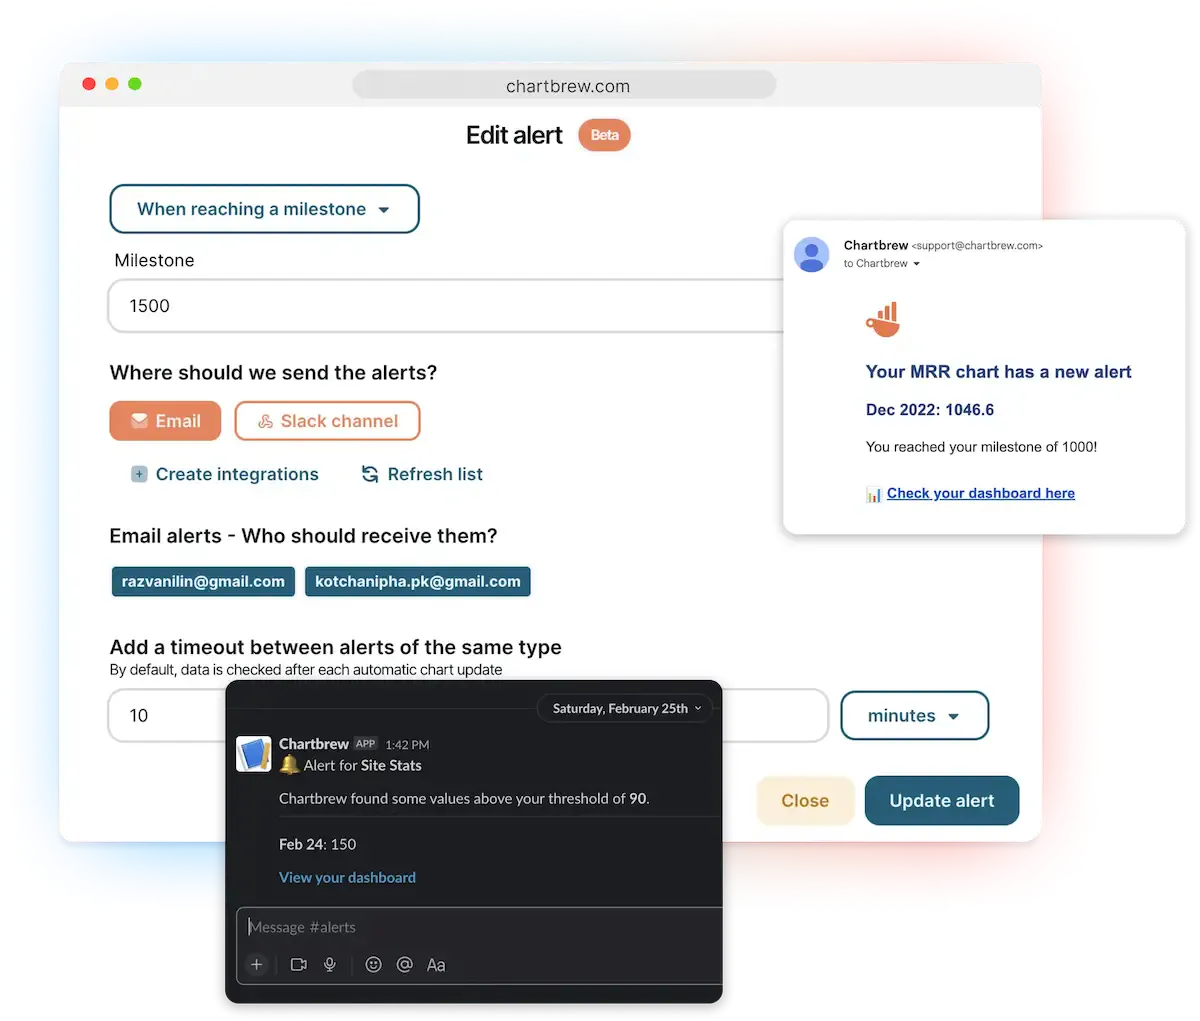
- Email, Slack, and webhook alerts - get alerts about milestones and anomalies in your data
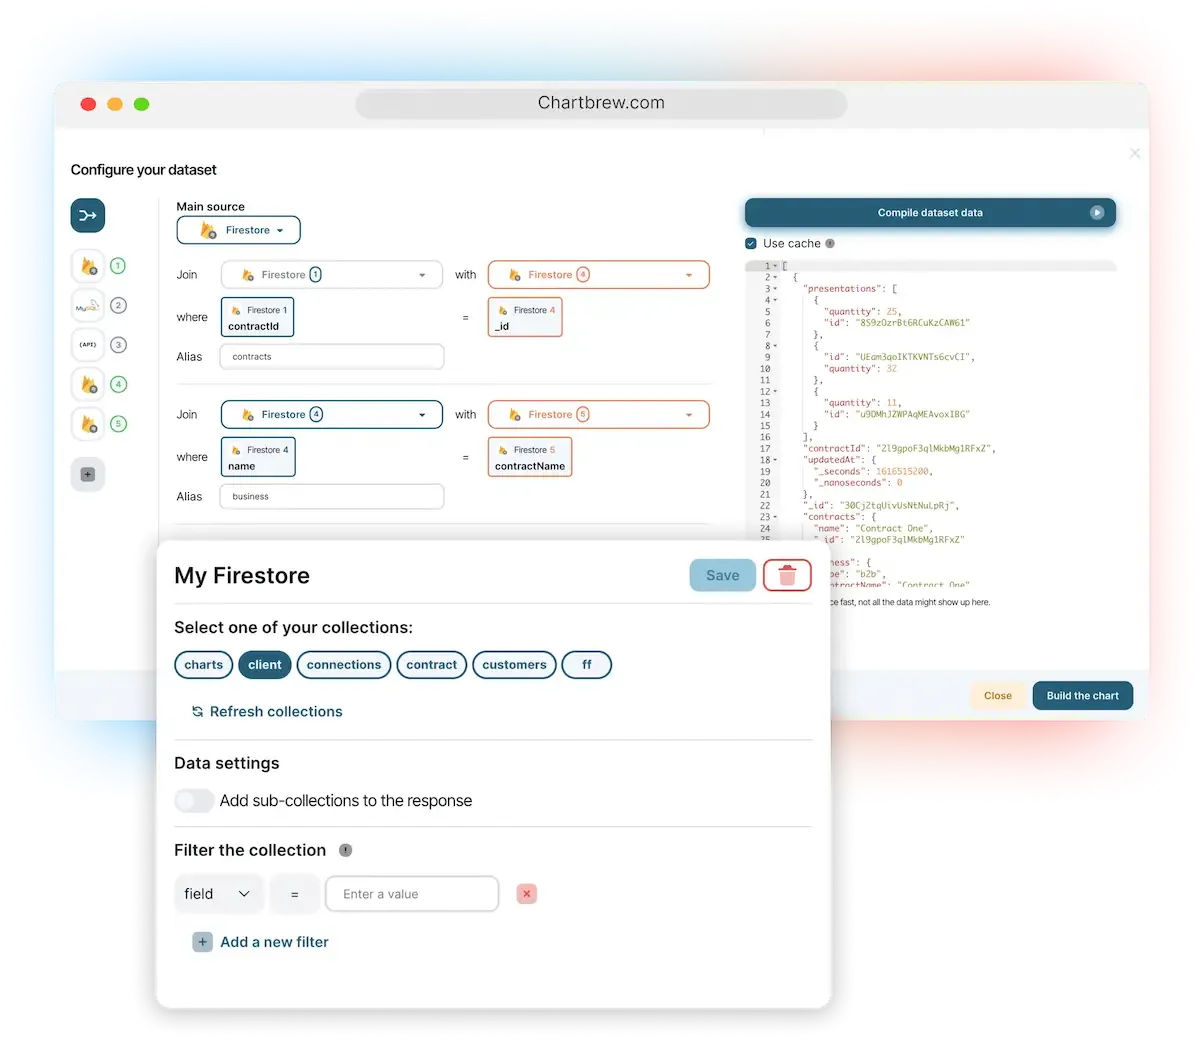
- Dataset joins - join data from multiple sources and create columns based on your dataset
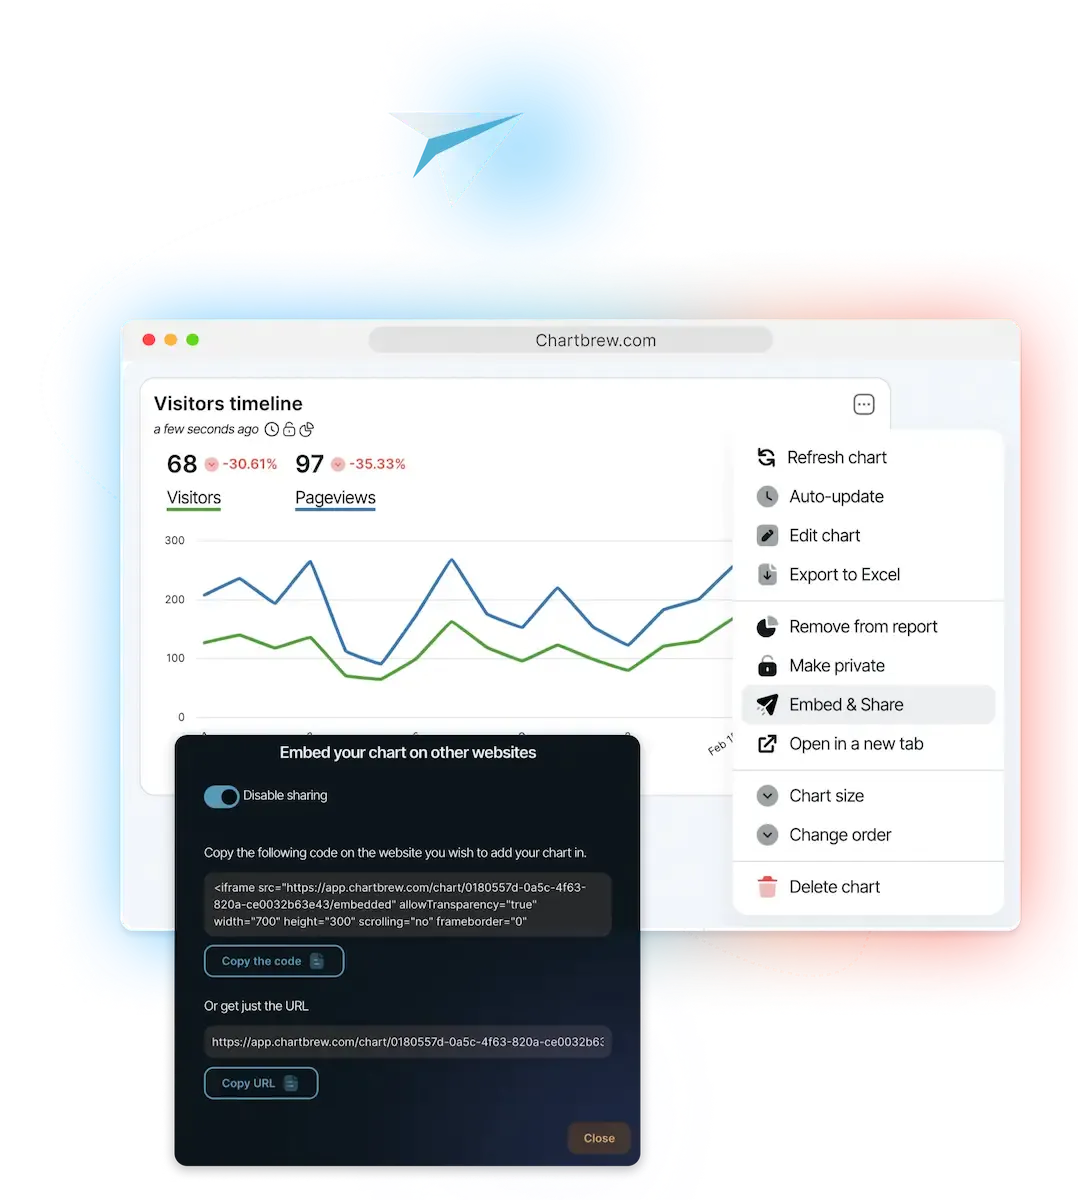
- Sharing and embedding - share charts and reports with the public, your team, or create secret links
- Teams support - invite team members to collaborate on your dashboards, and assign roles to team members
- Dashboard templates - quickly use existing templates or create your own
👟 Getting started with Chartbrew
Chartbrew works with MySQL and PostgreSQL. You can use either one, but you need to create a database first.
Then you can get and set up the project:
git clone https://github.com/chartbrew/chartbrew.git
cd chartbrew && npm run setup# frontend
cd client/
npm run start
# backend
cd server/
npm run start-dev
You can also run the application with docker. Before running the commands, make sure you have a MySQL server already running and an empty database that Chartbrew can use. The database name should match the value of the CB_DB_NAME variable.
docker pull razvanilin/chartbrew

docker run -p 4019:4019 -p 4018:4018 \
  -e CB_SECRET=enter_a_secure_string \
  -e CB_API_HOST=0.0.0.0 \
  -e CB_API_PORT=4019 \
  -e CB_DB_HOST=host.docker.internal \
  -e CB_DB_PORT=3306 \
  -e CB_DB_NAME=chartbrew \
  -e CB_DB_USERNAME=root \
  -e CB_DB_PASSWORD=password \
  -e REACT_APP_CLIENT_HOST=http://localhost:4018 \
  -e REACT_APP_API_HOST=http://localhost:4019 \
  razvanilin/chartbrew
For more info, see the official getting started page.
Or check out the live demo in just one click.